
Velocity

Method

Know what’s behind every result.

Clear choices, visible bases and explanations where you need them. Confidence comes from being able to see how a result was reached.

Who is included?

See who counts before you apply the change.

Choose the answers and the population together. Preview the result, its base and who is left out before creating your measure.
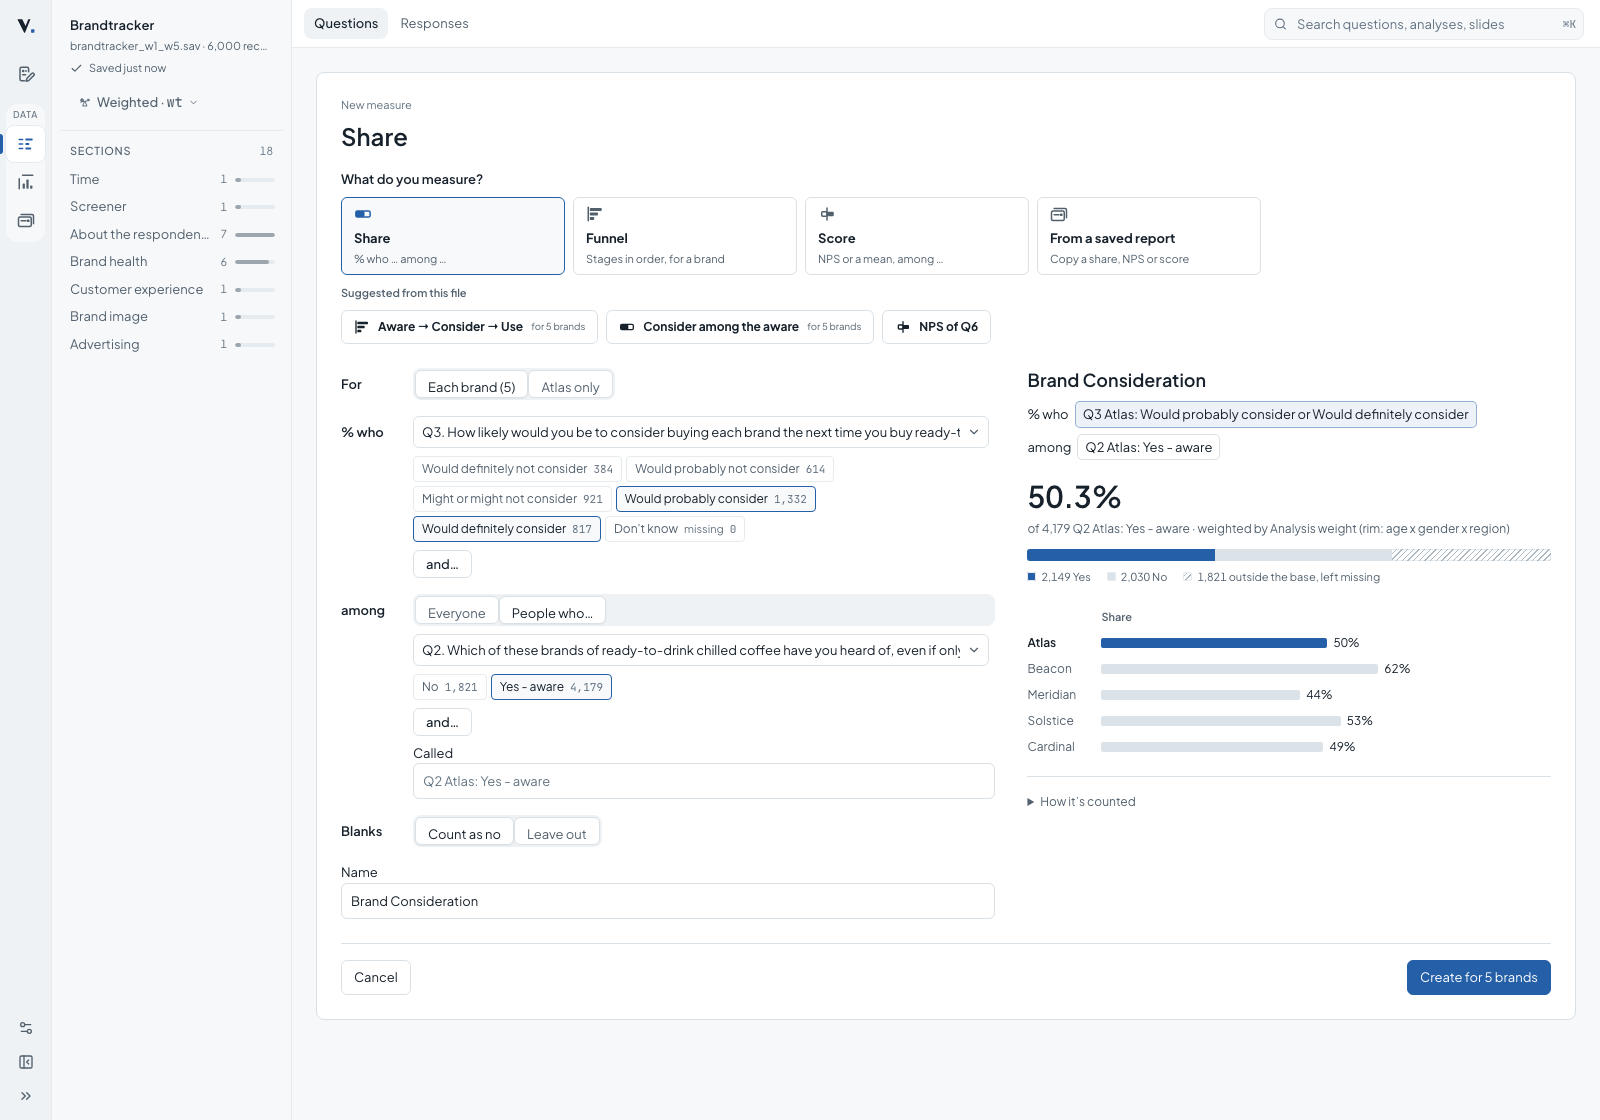
Velocity measure editor showing selected consideration answers, the awareness base, excluded respondents and a live preview.
A real measure preview: consideration among people aware of each brand.

What does this difference mean?

Understand the comparison behind the marker.

Inspect a cell to see its count, base, weight and comparison. Open the statistical detail when you need to go deeper.
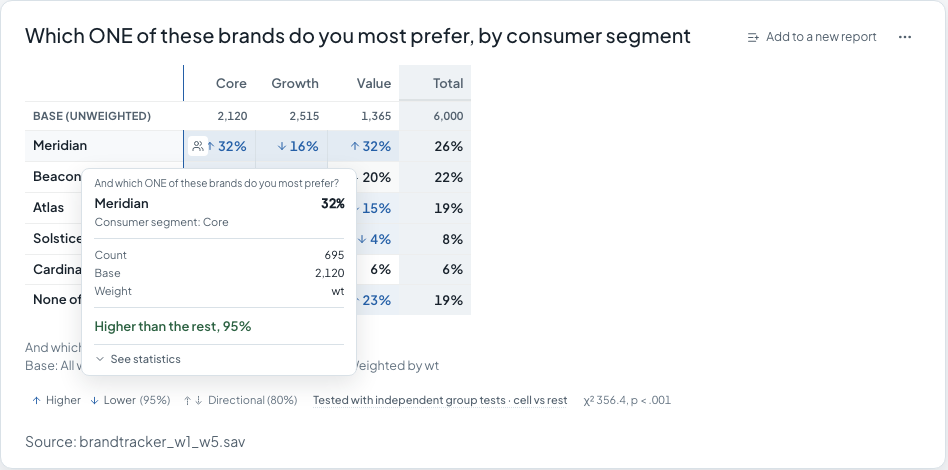
Real Velocity crosstab with Meridian among Core respondents highlighted and an explanation showing 32%, count 695, base 2,120, weight wt, and higher than the rest at 95%.
The cell explains whose result this is and how it compares with the rest.

Can I explain this in my report?

Keep the context with the finding.

Carry the question, base, weighting and source onto the slide. Shape the story with the detail behind it still visible.
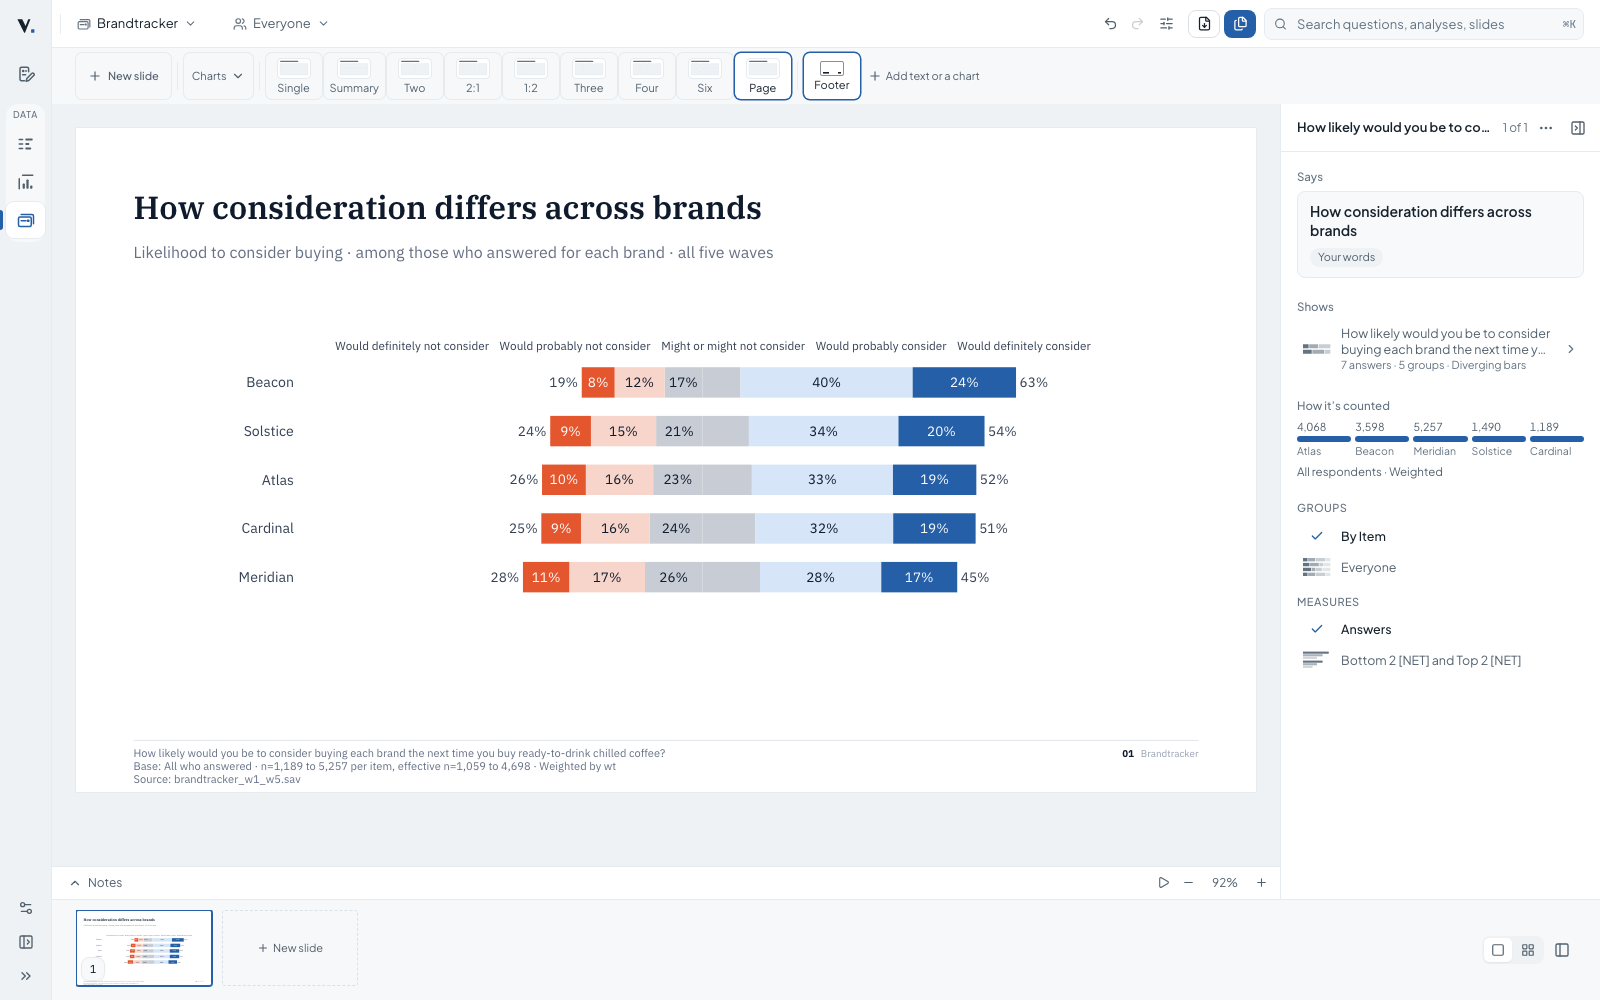
Velocity report editor with a consideration chart and a footer naming its question, bases, weight and source.
The source and respondent bases stay with the chart.

Real product screenshots using synthetic survey data and fictional brands. Each illustrates a different check; the measure preview uses its own stated base and weight. Select an image to inspect it at full size.

Try it for yourself

What changes when the base changes?

Explore sixteen answers. Change a choice, see who contributes and compare the result with an independent R calculation.

Explore the interactive lesson →

Technical details, when you need them.

Methods, assumptions and limits for the results you’re reading.

Reading your file
Questions
Grouped from the file, with its wording and answer labels.
Codes and labels
Kept together through every table and export.
Missing codes
Blank and declared missing codes leave valid-answer bases. Keeping “Don’t know” as a category is a researcher choice.
Grids and multi-response
Taken from the file, or suggested when it has none.
Weights and bases
Weight
Suggested from the file for you to confirm or change. Results use the selected weight; unweighted analysis is also available.
Bases
Unweighted counts, weighted totals and effective bases are available in the table details. Check the contributing population and missing-answer treatment.
Create a weight
Fit a weight to labelled categorical targets with raking. Inspect convergence, bounds and weight efficiency before saving. Targets need eligible respondents, and a fit that has not converged cannot be saved. Weight efficiency describes dispersion; it does not establish that bias has been removed.
Effective base
(Σw)² ÷ Σw². Kish effective n describes weight dispersion and is used for minimum-base checks and pointwise proportion intervals. It is not the variance of the ordinary weighted comparison test.
Who is counted
Answered or everyone
Choose the base explicitly. Missing answers leave an answered base; with an everyone base, they can remain in the denominator without counting as a positive response. Grid items retain their own respondent bases.
NETs and rebasing
A NET counts each respondent once, even when they select several of its answers. Rebase a supported table to a named NET to read the results among those respondents. Showing a NET row alone does not change the base.
Conditional measures and funnels
Inspect the counted answers, eligible population and missing-answer treatment before creating a reusable question. Overall funnel stages and conversion from the previous stage use different bases; the definition makes that choice explicit.
NPS
Among valid answers from 0 to 10, subtract the percentage scoring 0–6 from the percentage scoring 9–10. Scores of 7–8 remain in the base.
Significance
Tables
Cell against the rest, or pairwise columns. Independent-column proportions use pooled Pearson tests without weights and second-order Rao–Scott 2×2 tests with fixed weights. Means use ratio-linearized variance and Welch–Satterthwaite degrees of freedom with a two-sided Student t reference.
Whole-table association
Exclusive categorical tables use Pearson chi-square without weights. Weighted totals are calibrated to whole-table Kish effective n before Pearson's test: a bounded approximation, distinct from the cell comparisons. Multiple-response tables have no ordinary omnibus test.
Time comparisons
Analysis supports prior-wave and same-period-last-year comparisons. Declare the categorical wave order or calendar period; missing reference periods are not tested. Ordinary time comparisons use their separately defined unpooled Wald/Kish method with a normal reference and planned-reference correction family. Tracker and other study reports retain their declared methods. Repeated-person panels need paired inference, not independent-wave tests.
Overlapping columns
Supported pairwise share comparisons include the covariance of shared respondents. Cell-against-rest comparisons are withheld for overlapping banners.
Corrections
None, Bonferroni, Holm or Benjamini–Hochberg. Ordinary pairwise comparisons are corrected within each row; cell-against-rest tests span non-NET cells, with each NET in a separate family. Only estimable ordinary comparisons enter these correction families; unavailable comparisons receive no significance mark.
Inspect the result

Inspect a table cell to see its question, answer, comparison group, count, base and weight. Open the statistical detail for the comparison’s test figures. An unavailable test has a reason; it is not presented as evidence of no difference.

Footers carry population, base, weighting and source context. A grid’s base is the respondents behind each item, not the sum of its answers, NETs and means. Positive-share ranking changes the order of items, not their scores or tests.

Uncertainty and limits

Ordinary proportion intervals use Wilson intervals on Kish effective bases; mean intervals use ratio-linearized variance with a normal reference. These are pointwise intervals, not simultaneous guarantees or the comparison test itself.

Ordinary tests assume independent respondents and fixed weights. They do not account for clusters, strata, finite-population corrections or uncertainty in estimated weighting targets. Separately declared study methods retain their own rules. Undefined tests are reported as unavailable, not as evidence of no difference.

A separate formal stratified comparison is available for explicitly declared designs. It requires the full sampled file, fixed positive weights, strata and comparison families; it does not silently upgrade ordinary tables. It has no finite-population correction, and undefined stratum variance is not estimable.

Automatic report wording describes displayed statistics. The researcher supplies interpretation. Agreement on tested examples does not establish universal parity with another package or prove that a method is appropriate for every study.

Output
PowerPoint
Supported charts and tables remain editable; some forms use images. Data results carry base, weight and method disclosures.
Excel
Export table results to an editable workbook.
Google Workspace
Export tables to Google Sheets and reports to Google Slides. Supported linked charts use a companion Sheet and can be updated in Slides after editing there. Slide text and research disclosures remain snapshots; fonts and chart support vary by destination.
Session file
Your project, analyses and reports in one file to share.
Your data

Importing a survey file for browser analysis keeps it on your device; it is not uploaded to Velocity for analysis. Projects and recovery data are saved in this browser. Microsoft Office exports download locally.

Choosing Google Workspace export sends the selected report or workbook to Google. A data-sheet export can include individual respondent rows. If you use an AI assistant or MCP client, that application can receive prompts and tool results under its own settings and privacy notice.

Read the privacy notice →